Once you see a chart, you sometimes struggle to un-see it… This is the Naz during the 2000 tech bubble.
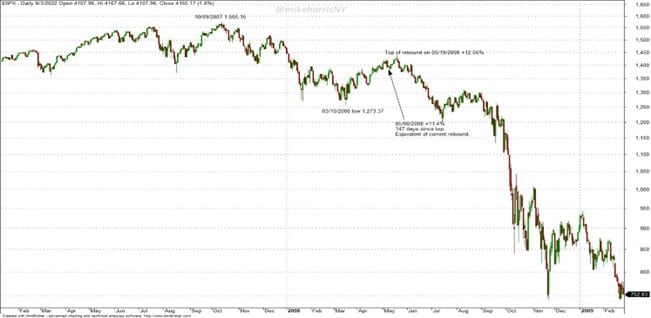
Now let’s look at the GFC. Note a pattern? A smash, then consolidate, then leak lower until the real selling starts.
It’s almost a chart crime to then pull up 1929, but we can’t help ourselves…
Once again, a smash, a bounce that rolls. Then the real selling starts. What’s interesting is that the intermission between the crash and the real selling is about 6 months. Those are the hardest six months of a bear’s life. The economic data is still strong. All your friends are buying the dip like lunatics. You can’t short it because it’s very whippy and wild. You can’t buy it because you know what’s coming next. All you can do is stand aside—or at least you should. Instead, most of the fukwits double down on the long side. In fact, they chase so hard that you get Zweig Breath Thrusts to the upside as they panic buy ETFs that then push everything higher. This isn’t normal. It’s not healthy. It’s smart money selling to monkeys and we feel like we’ve seen this movie before…
Go and look at the real economy. Look at the S&P 600. If you called it a benchmark of sh*tcos, we wouldn’t disagree. Except to note that the real economy is also mostly a basket of privately owned sh*tcos. This isn’t a healthy chart. It looks like a dead-cat bounce, before we take out the lows from the mini-recession of 2022. In fact, most charts outside of a handful of tech names look like this, even in the larger cap S&P 400. Even the equal-weighted S&P 500 looks bad. We’d bet the S&P 475 looks even worse than the RSP. That’s because the economy is rolling over. It’s becoming obvious. Meanwhile, the tech companies don’t see it yet, but when their customers stop spending, they’ll see the pain too, and from a higher valuation level—hence further to fall. Of course, since no one knows what PLTR does, they keep crowding into it and a few other momentum names, but that isn’t a market. That’s just a speculative orgy.
We think the real economy breaks first, then drags everything else down. 1200 on the S&P 600 is probably your cue to panic. Of course, we think that the rest of the market chops before it rolls. Maybe the tech names even make a new marginal high. We have no idea. We just think it’s all bad. Very Bad. Like we’ve said a few times now, we’ve seen this movie before and we think we know how it ends…
…it ends when the Fed panics. But the Fed won’t panic until there’s an actual crisis. Think back to 2008, when they started to cut rates, that was when the real selling started. Same goes for 2001. To avert what’s coming, you’re going to need a quantum of liquidity that is large enough to break the dollar and break the Treasury market. You need “Project Zimbabwe,” and we don’t think JPOW is the man who wants to be responsible for it. Not until he has no choice…
…But the 2000 tech smash was because of internet companies with no earnings finally getting fairly valued. 2008 was when complex derivatives blew up. 1929 was a deflationary bust. We’ve been reading you for ages and you expect an inflationary crack-up. How do we crash??
What if we don’t crash. What if it’s just a fade lower over many years, like when Japanese Exceptionalism ended, or when the Nifty 50 ended. Multiples slowly compress as they try to massage the bond market lower for a few years, before they give up and launch it all. What if the S&P earnings come in at $220 down from estimates around $260 (tariffs and interest rate drag). What if we then trade at 13x that because 10s are at 6%?? Then you get 2860 on the S&P. We’re not saying it gets hit that hard, we’re not saying it doesn’t get hit harder either. We’re just trying to think out loud about where ‘fair value’ would be in an interest rate environment that seems quite likely.
When you tell the foreigners to go home and leave your market, bonds blow out, and then crowd out equities. It happened in Brazil. It happened in Turkey. It happened in the US in the 1970s. It can happen again. We think it likely happens again. What if this chart reverses and a few trillion of foreign capital tries to leave…?? As so much of the US economy is tied to the Wealth Effect, it sort of feeds on itself, reflexively.
We posted this chart a few weeks ago. Remember what we said about there being no such thing as a quadruple bottom?? Well, bonds bounced for two weeks with equities. Now bonds have started rolling over again, even as leading economic data like PMI and ISM are weakening. If bonds can’t rally on bad data, then we really are an EM. TLT under $85 means that everything dies. We’re watching this, terrified that the equity market is on borrowed time—though based on past history, it probably takes another few months to play out first.
Anyway, you know where we stand. It could be a crash, it could be a slow fade, maybe we just chop wood for a decade until earnings catch up. We definitely aren’t saying that we’re about to waterfall in 6 months, though we could. We certainly think that the smash, 6 month rally, then fade, is an interesting chart pattern to be aware of, as these things tend to rhyme. With the strength of the bounce, we can’t help but think of 2000, when everyone wanted to believe it was an ‘all clear’ moment. From a sentiment perspective, it feels more like 2008. Anything is possible, we’re just bearish equities. Very bearish…
We think the Fed eventually steps in and tries to save the market, they probably just make it all worse by making it inflationary, but first they need to see actual pain. We need a reset of the global system where mercantilist countries stop dumping product on us. We need a way to force them to consume more (which they refuse to). We need everyone to “Run It Hot” to escape the debt trap. Yet many countries are unwilling to do that, as it upsets their model of running a sweat shop that benefits the 0.1%. To counter their intransience, we need to weaken the Dollar dramatically. As foreigners wise up to this, they will front-run it, and exit our markets. Trump for all his craziness is trying to force change, but it’s only accelerating the inevitable reckoning. Now it seems increasingly likely that the world can only reset with a crisis. However, there are many steps along the way to the crisis. In investing, you don’t want to get more than a move ahead.
We keep asking ourselves, what business actually does well when 10s are at 6% on the way to 8%. We’re sorta stumped. We think it happens with DXY leaking lower too. We’re going to open a room on the KEDM Discord to discuss this, as we want plays on this. We think the trend is a mega-trend for the rest of the decade, maybe even the only trend that matters.
Turning to our own books, when we lean this bearish, we prefer take our ball and go home. We don’t like to short, and we know we can’t be long as we’ll just get chopped up. We’ve gone through this a few times in our careers. In retrospect, we wish we had been far more aggressive during the times when we wholesale liquidated positions (winter 2007 and February 2020), as we still suffered on the way down. We harvested many positions in May of 2024. We cleaned up the small-caps and illiquids back then. Honestly, almost all of them are down from where we made sales. We wish we had sold far more as it was the top for most GDP sensitive businesses. Now we’re using this bounce to clean up the liquid stuff too. We think the right trading strategy is to simply sit in cash, write puts on the smashes, bleed the puts on the rips and find a handful of businesses that do well in this crazy world we’re about to enter. What does well when bonds blow out, FX blows out, there is a lot of economic volatility, added inflation, and a lot of fiscal prolificacy?? Gold and what else…?? We’re in search of the answer…
Before, we move on, we want to leave you with one last chart. Since so much of our market is owned by foreigners, just think about how much pain they’re taking. This is the SPY, but priced in EUR. To foreigners, our market has barely even bounced. In fact, it looks a lot like the charts above of proper crashes. Here in USA, we may still want to BTFD, but overseas, they’re catatonic about what just happened to their books. We think they turn sellers on any further bounce…
Moving from the doom porn and into ED, it’s that time of the year again where illiquids have all sorts of cross currents as the Russ2k moves towards its rebal. This week was rank day (4/30). Official lists hit the tape on May 23 with an effective date of June 27th. In the meantime, our friends at Instinet are speculating there will be 16 additions and 1 deletion in the Russell 1000 and 237 additions and 139 deletions in the Russell 2000. Worth scrolling through the spread below, but a few summary tables to whet the appetite…
Kuppy’s Event Driven Monitor (“KEDM”) is not a financial or investment advisor and the information contained in this publication is not intended to constitute legal, accounting, or text advice or individually-tailored investment advice and is not designed to meet your personal financial situation. The investments discussed in this publication may not be suitable for you. You are required to conduct your own due diligence, analyses, draw your own conclusions, and make your own investment decisions. Any areas concerning legal, accounting, or tax advice or individually-tailored investment advice should be referred to your lawyers, accountants, tax advisors, investment advisers, or other professionals registered or otherwise authorized to provide such advice. KEDM makes no recommendations whatsoever regarding buying, selling, or holding a specified security, a class of securities, or the securities of a class of issuers, and all commentary is for educational purposes only. The investment examples noted are intended to provide and example of the events and data KEDM flags each week and is not representative of typical returns generated by each event or any future returns.
Save your cart?
x
We save your email and cart so we can send you reminders - don't email me.

Dead Cat Bounce
A low frequency but juicy strategy where the edge is government incompetence.
Let’s dig in…
Once you see a chart, you sometimes struggle to un-see it… This is the Naz during the 2000 tech bubble.
Now let’s look at the GFC. Note a pattern? A smash, then consolidate, then leak lower until the real selling starts.
It’s almost a chart crime to then pull up 1929, but we can’t help ourselves…
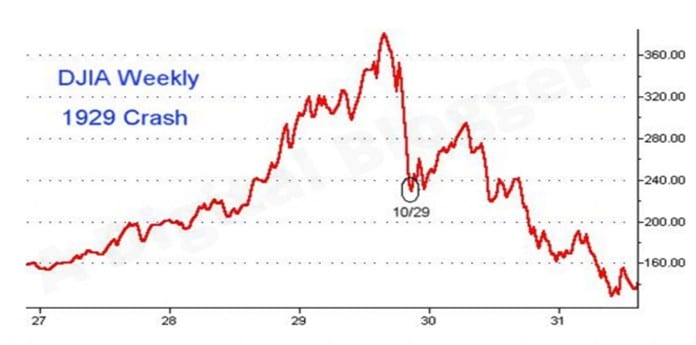
Once again, a smash, a bounce that rolls. Then the real selling starts. What’s interesting is that the intermission between the crash and the real selling is about 6 months. Those are the hardest six months of a bear’s life. The economic data is still strong. All your friends are buying the dip like lunatics. You can’t short it because it’s very whippy and wild. You can’t buy it because you know what’s coming next. All you can do is stand aside—or at least you should. Instead, most of the fukwits double down on the long side. In fact, they chase so hard that you get Zweig Breath Thrusts to the upside as they panic buy ETFs that then push everything higher. This isn’t normal. It’s not healthy. It’s smart money selling to monkeys and we feel like we’ve seen this movie before…
Go and look at the real economy. Look at the S&P 600. If you called it a benchmark of sh*tcos, we wouldn’t disagree. Except to note that the real economy is also mostly a basket of privately owned sh*tcos. This isn’t a healthy chart. It looks like a dead-cat bounce, before we take out the lows from the mini-recession of 2022. In fact, most charts outside of a handful of tech names look like this, even in the larger cap S&P 400. Even the equal-weighted S&P 500 looks bad. We’d bet the S&P 475 looks even worse than the RSP. That’s because the economy is rolling over. It’s becoming obvious. Meanwhile, the tech companies don’t see it yet, but when their customers stop spending, they’ll see the pain too, and from a higher valuation level—hence further to fall. Of course, since no one knows what PLTR does, they keep crowding into it and a few other momentum names, but that isn’t a market. That’s just a speculative orgy.
We think the real economy breaks first, then drags everything else down. 1200 on the S&P 600 is probably your cue to panic. Of course, we think that the rest of the market chops before it rolls. Maybe the tech names even make a new marginal high. We have no idea. We just think it’s all bad. Very Bad. Like we’ve said a few times now, we’ve seen this movie before and we think we know how it ends…
…it ends when the Fed panics. But the Fed won’t panic until there’s an actual crisis. Think back to 2008, when they started to cut rates, that was when the real selling started. Same goes for 2001. To avert what’s coming, you’re going to need a quantum of liquidity that is large enough to break the dollar and break the Treasury market. You need “Project Zimbabwe,” and we don’t think JPOW is the man who wants to be responsible for it. Not until he has no choice…
…But the 2000 tech smash was because of internet companies with no earnings finally getting fairly valued. 2008 was when complex derivatives blew up. 1929 was a deflationary bust. We’ve been reading you for ages and you expect an inflationary crack-up. How do we crash??
What if we don’t crash. What if it’s just a fade lower over many years, like when Japanese Exceptionalism ended, or when the Nifty 50 ended. Multiples slowly compress as they try to massage the bond market lower for a few years, before they give up and launch it all. What if the S&P earnings come in at $220 down from estimates around $260 (tariffs and interest rate drag). What if we then trade at 13x that because 10s are at 6%?? Then you get 2860 on the S&P. We’re not saying it gets hit that hard, we’re not saying it doesn’t get hit harder either. We’re just trying to think out loud about where ‘fair value’ would be in an interest rate environment that seems quite likely.
When you tell the foreigners to go home and leave your market, bonds blow out, and then crowd out equities. It happened in Brazil. It happened in Turkey. It happened in the US in the 1970s. It can happen again. We think it likely happens again. What if this chart reverses and a few trillion of foreign capital tries to leave…?? As so much of the US economy is tied to the Wealth Effect, it sort of feeds on itself, reflexively.
We posted this chart a few weeks ago. Remember what we said about there being no such thing as a quadruple bottom?? Well, bonds bounced for two weeks with equities. Now bonds have started rolling over again, even as leading economic data like PMI and ISM are weakening. If bonds can’t rally on bad data, then we really are an EM. TLT under $85 means that everything dies. We’re watching this, terrified that the equity market is on borrowed time—though based on past history, it probably takes another few months to play out first.
Anyway, you know where we stand. It could be a crash, it could be a slow fade, maybe we just chop wood for a decade until earnings catch up. We definitely aren’t saying that we’re about to waterfall in 6 months, though we could. We certainly think that the smash, 6 month rally, then fade, is an interesting chart pattern to be aware of, as these things tend to rhyme. With the strength of the bounce, we can’t help but think of 2000, when everyone wanted to believe it was an ‘all clear’ moment. From a sentiment perspective, it feels more like 2008. Anything is possible, we’re just bearish equities. Very bearish…
We think the Fed eventually steps in and tries to save the market, they probably just make it all worse by making it inflationary, but first they need to see actual pain. We need a reset of the global system where mercantilist countries stop dumping product on us. We need a way to force them to consume more (which they refuse to). We need everyone to “Run It Hot” to escape the debt trap. Yet many countries are unwilling to do that, as it upsets their model of running a sweat shop that benefits the 0.1%. To counter their intransience, we need to weaken the Dollar dramatically. As foreigners wise up to this, they will front-run it, and exit our markets. Trump for all his craziness is trying to force change, but it’s only accelerating the inevitable reckoning. Now it seems increasingly likely that the world can only reset with a crisis. However, there are many steps along the way to the crisis. In investing, you don’t want to get more than a move ahead.
We keep asking ourselves, what business actually does well when 10s are at 6% on the way to 8%. We’re sorta stumped. We think it happens with DXY leaking lower too. We’re going to open a room on the KEDM Discord to discuss this, as we want plays on this. We think the trend is a mega-trend for the rest of the decade, maybe even the only trend that matters.
Turning to our own books, when we lean this bearish, we prefer take our ball and go home. We don’t like to short, and we know we can’t be long as we’ll just get chopped up. We’ve gone through this a few times in our careers. In retrospect, we wish we had been far more aggressive during the times when we wholesale liquidated positions (winter 2007 and February 2020), as we still suffered on the way down. We harvested many positions in May of 2024. We cleaned up the small-caps and illiquids back then. Honestly, almost all of them are down from where we made sales. We wish we had sold far more as it was the top for most GDP sensitive businesses. Now we’re using this bounce to clean up the liquid stuff too. We think the right trading strategy is to simply sit in cash, write puts on the smashes, bleed the puts on the rips and find a handful of businesses that do well in this crazy world we’re about to enter. What does well when bonds blow out, FX blows out, there is a lot of economic volatility, added inflation, and a lot of fiscal prolificacy?? Gold and what else…?? We’re in search of the answer…
Before, we move on, we want to leave you with one last chart. Since so much of our market is owned by foreigners, just think about how much pain they’re taking. This is the SPY, but priced in EUR. To foreigners, our market has barely even bounced. In fact, it looks a lot like the charts above of proper crashes. Here in USA, we may still want to BTFD, but overseas, they’re catatonic about what just happened to their books. We think they turn sellers on any further bounce…
Moving from the doom porn and into ED, it’s that time of the year again where illiquids have all sorts of cross currents as the Russ2k moves towards its rebal. This week was rank day (4/30). Official lists hit the tape on May 23 with an effective date of June 27th. In the meantime, our friends at Instinet are speculating there will be 16 additions and 1 deletion in the Russell 1000 and 237 additions and 139 deletions in the Russell 2000. Worth scrolling through the spread below, but a few summary tables to whet the appetite…
Most illiquid buys:
Most illiquid sells:
Start your 28-day free trial
Kuppy’s Event Driven Monitor (“KEDM”) is not a financial or investment advisor and the information contained in this publication is not intended to constitute legal, accounting, or text advice or individually-tailored investment advice and is not designed to meet your personal financial situation. The investments discussed in this publication may not be suitable for you. You are required to conduct your own due diligence, analyses, draw your own conclusions, and make your own investment decisions. Any areas concerning legal, accounting, or tax advice or individually-tailored investment advice should be referred to your lawyers, accountants, tax advisors, investment advisers, or other professionals registered or otherwise authorized to provide such advice. KEDM makes no recommendations whatsoever regarding buying, selling, or holding a specified security, a class of securities, or the securities of a class of issuers, and all commentary is for educational purposes only. The investment examples noted are intended to provide and example of the events and data KEDM flags each week and is not representative of typical returns generated by each event or any future returns.