
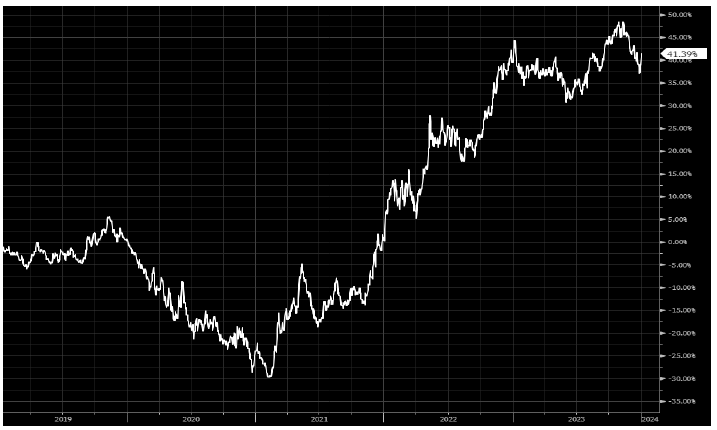
With our resolutions out of the way, lets spend a bit of time chatting buybacks since they have been the massive factor outperformer in the past few years. See chart below using Russell as the underlying universe:
As inflection investors, we are often presented with two scenarios 1) industries that have been left for dead -e.g. O&G, OSVs, coal– and 2) industries firing on all cylinders but the market is discounting due to past cyclicality (cyclical vs. secular tailwind) – e.g. RoRo, building supplies, etc. Companies in both categories often trade at low single digit multiples on cash flow because of piss poor past performance or current performance being viewed as unsustainable. Often times, after years of a bear market, the supply/demand dynamics of these industries structurally changes through consolidation, increased demand with no new supply being brought online (capital starved), or permanent supply destruction. Buybacks can serve as a critical catalyst for these types of opportunities as they deliver an enormous amount of shareholder value when these stocks trade at low single digit P/Es. Moreover, as executives shrink the share count and create a tighter float, you tend to get some outsized moves in the late innings when that tailwind gains steam and investors realize that the cyclical is in fact a secular and there is no float (or dilution)…
And lets of course not forget taxes! Remember, buybacks are much more tax efficient than double taxing dividends (we Puerto Ricans are super focused on taxes!). Why the hell would I want a dividend when a company can reinvest at 30% ROIC or buy back their stock a 3x CF??
While not a full proof strategy, we find a ton of our names are heavy on the buyback and watch these Monitors closely. And as long as they actually shrinking the share count (not covering SBC) and doing so out of FCF (not levering up), we are all for it.
Now let’s take a look at the data…we pulled the top 125 buyback leaders and they are averaging a cool 16% 5-year annualized return, just slightly outpacing the broad market. But there are real gems in here like the top performer over the 5yr period – our good friend BLDR (the one that got away) which sports a 69% annualized return. Pretty damn impressive.
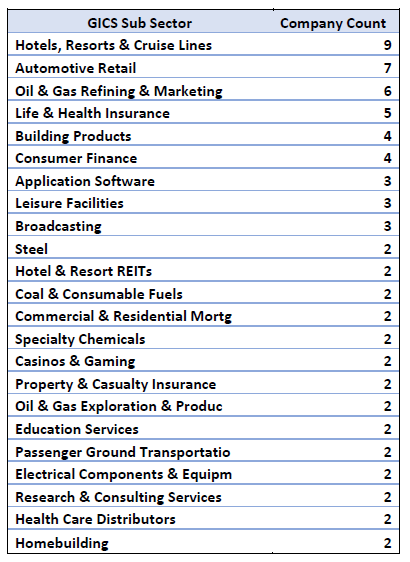
Also interesting is the break down according to GICS Sectors and Sub-Sectors. Unsurprisingly, the leaders here are leaning “old economy” (left for dead) and energy related (secular vs cyclical)…the old economy is back- flush with cash and ready to party…
While this KEDM Buyback Leaderboard doesn’t change very often (our current Completed Buyback Monitor has a ton of crossover but is much more dynamic), we think its worth keeping on KEDM. So going forward, we will be adding the KEDM Buyback Leaderboard to these pages which we will update each Q. Any QoQ changes or new names, we will be sure to flag. We think these 3 combined Buyback Monitors (Announced, Completed, and Leaderboard) will continue to hit real paydirt and uncover a ton of gems throughout 2024…