
The core principal of Event-Driven trading is that corporate events can be catalysts for change.
Sometimes those events are catalysts for improvement in fundamentals of the business (like CEO Changes) that eventually play through to the stock price.
Many other types of events, although intrinsically related to the fundamentals of the business, are much more about technical factors, changes in ownership, or shifts in corporate structure that could affect the supply and demand for the shares over a given period of time.
IPO Unlocks are one of those monitors where we are more focussed on those technical factors.
What are IPO Unlocks? Keep reading to learn more…
An IPO Unlock is a date that marks the end of the “lockup period,” usually 90 or 180 days after the IPO, where major shareholders and insiders of a recently IPO’d company are finally allowed to sell their shares on the open market after previously being “locked out”. The exact stipulations of these restrictions are outlined in the S-1 for the IPO with updates to the S-1 (S-1As) outlining any changes.
Prior to this “unlock date” the recently listed shares have begun trading on the open market but those founders, employees, and early investors (often VCs) have been kept out of the market to avoid creating overwhelming selling pressure that could harm investors who’ve just been convinced by the sponsoring investment bank to participate in the IPO placement.
It’s important to remember that each IPO is different, with different corporate fundamentals, ownership bases, and market environments. All of these factors need to be considered when assessing if/how to play an IPO Unlock.
We can’t look at every type of IPO here, so for our sake we’ll focus on the hypothetical example of a recently IPO’d tech company that is taking advantage of a market environment where the shares are being generously valued (ie. a tech bubble).
Let’s say our hypothetical tech company has IPO’d as a multi-billion dollar unicorn that has made a lot of money for the founders, early employees, and the VCs who funded the company prior to the IPO. Arguably each of these groups of people have taken large risks and have considerable portions of their own wealth, or in the case of the VCs, their investors wealth tied up in this company.
The founders are billionaires but only on paper until they sell some their shares, early employees can finally reap the rewards of taking on high risk/stress roles common at tumultuous start up companies, and the VCs are most likely not in the business of holding public companies and need to crystalize this gain to offset losses in other investments that have failed to achieve a successful exit.
Again, every case is different but you can see why in the case of our generously valued tech bubble company (and often still in the case of fairly or cheaply valued companies) these groups have an incentive to sell their shares as soon as they are able and without much concern for the price on any given day. Most IPOs offer less than 20% of the outstanding shares to the market so you can see how these large groups of indiscriminate sellers could create excessive volume and volatility once they are finally allowed to sell.
That volatility is precisely what makes IPO Unlocks such an interesting event to track and trade around. They can be opportunities to take advantage of spikes in volatility and write options, opportunities to take directional bets like shorts if you think that the unlock will trigger a wave of selling, and even opportunities to buy cheaply if that selling pushes the stock down to a level that you might consider the company to be cheap.
Of course, if it always worked out that these events caused sell-offs the market would sniff that out, so it’s also important to remember that other investors and traders know about these unlocks too. If too many people position for a wave of selling that doesn’t show up, you could end up with a wave of buying as traders cover their shorts or close options trades.
With all of these different possible outcomes how do you even start to think about trading unlocks?
Each situation is different and should be assessed on an individual basis but often times IPO Unlocks behave similarly for periods of time. Some people call these groups of IPO Unlocks vintages or cohorts but whatever you call them you can analyze them quantitatively to get some idea of how they are behaving recently and historically.
Here at KEDM we did that analysis in 2021 and again in 2023. Click the button to read our IPO Unlock Whitepapers from 2021 and 2023.
2020 into 2021 was a very interesting IPO vintage. In hindsight the steady supply of in 2020/2021 IPOs led to a massive supply of stock when insiders unlocked and rushed for the exits as uneconomical sellers. It seemed like a layup to get ahead of that wall of sellers (T minus 30 – See here for the KEDM report from back in 2021). Below is a table from that report, covering the 2021 IPO unlocks:
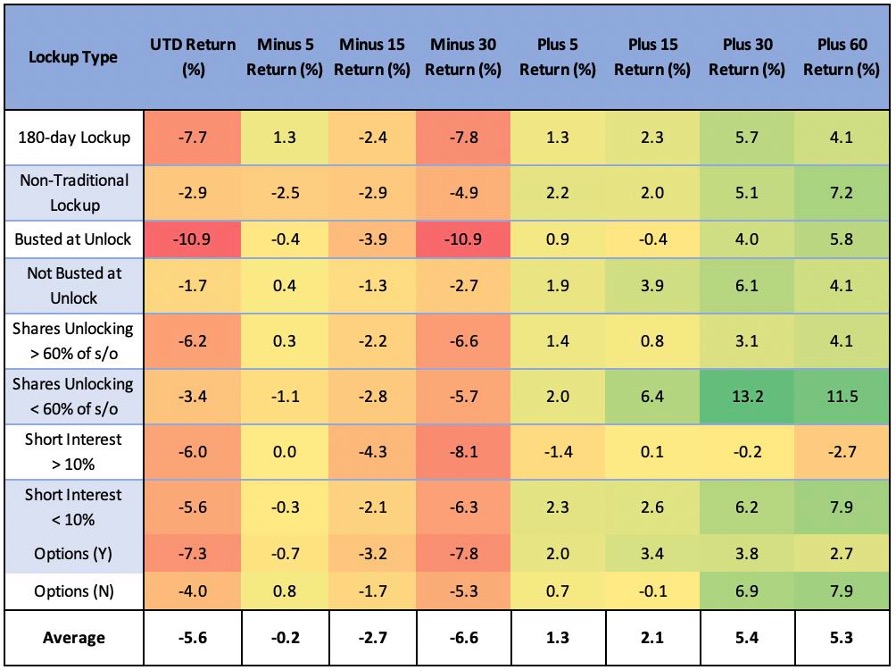
Back then, the data said there was weakness headed into the unlock (as smart traders got ahead of insiders) then decent positive performance post-lockup. Of course, the IPOs with a smaller unlock performed well post unlock, returning 11.5% over the next 60 days (~92% annualized). But what if you wanted to play games with the lockup period and burden investors with confusing legalese around what is unlocked and when? Who cares, no one read that stuff anyway, and you were averaging 7.2% over the 60 days post unlock! Hell, unlocks even appeared to be a catalyst for IPOs that were busted going into the unlock date, showing a +4.0% return 30 days post unlock after posting a -10.9% return over the 30 days going into the unlock.
When we reran the table for 2022 and 2023 unlocks, the tune has changed. Granted there’s been a IPO drought since the ‘20/21 IPO rush, so take it with a grain of salt:
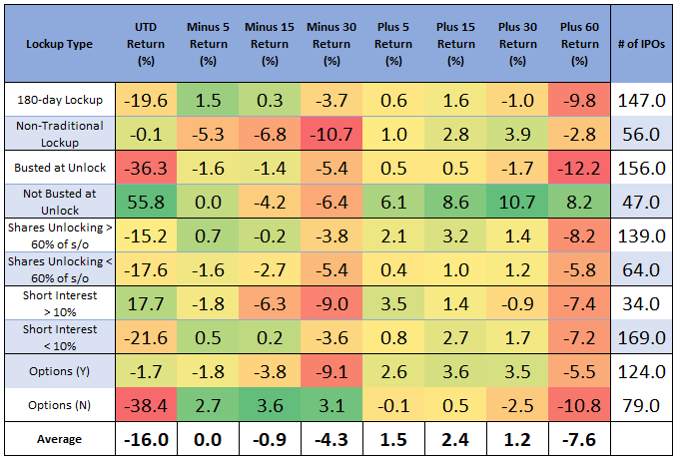
On average, companies were down -7.6% over the 60 days post unlock (vs +5.3% in the previous table) and down -16.0% unlock-to-date. Large unlocks (Shares unlocked > 60% of outstanding) were being hit, down -8.2% 60 days post unlock. There was no reprieve for the stragglers as companies busted at unlock were down another -12.2% 60 days post unlock and -36.3% unlock-to-date. Essentially, its red across the board, both pre and post unlock with the only green being the mega deals.
Will this latest Ponzi IPO cohort follow this trend??
Kuppy’s Event Driven Monitor (“KEDM”) is not a financial or investment advisor and the information contained in this publication is not intended to constitute legal, accounting, or text advice or individually-tailored investment advice and is not designed to meet your personal financial situation. The investments discussed in this publication may not be suitable for you. You are required to conduct your own due diligence, analyses, draw your own conclusions, and make your own investment decisions. Any areas concerning legal, accounting, or tax advice or individually-tailored investment advice should be referred to your lawyers, accountants, tax advisors, investment advisers, or other professionals registered or otherwise authorized to provide such advice. KEDM makes no recommendations whatsoever regarding buying, selling, or holding a specified security, a class of securities, or the securities of a class of issuers, and all commentary is for educational purposes only. The investment examples noted are intended to provide and example of the events and data KEDM flags each week and is not representative of typical returns generated by each event or any future returns.