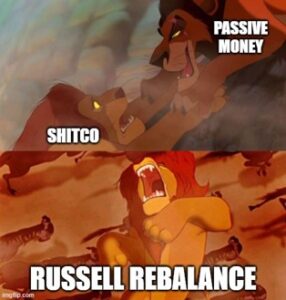
Russell rebalance
Before we dive into our thematic updates, we’d be remiss if we didn’t touch on the Russell rebalance this Friday. This is one of the few calendar events where fund flows overwhelm fundamentals.
David Einhorn famously used the example of jelly donuts: one is good, two are ok, and a dozen is fraternity pledging haze. Two decades ago, your typical index fund was probably a better option than giving money to an active manager. Fees were lower, and most managers couldn’t beat the index anyway, so why not be the index itself? That concept has gone so far that owning an index fund ought to give you the same bellyache as eating a dozen donuts.
Think about it: depending on the stock, index funds are 10-30% of the float. Closet index funds account for a large share of what’s left over. The signal-to-noise ratio is downright bastardized. Even worse, these entities buy based on certain mechanical rules that ignore fundamentals. Maybe this works for large liquid stocks. Who the hell is on the other side when an index fund dumps 20% of the float of an illiquid stock?
Well, we are.
On Friday, more than $200 billion will need to cross in the closing auction. Starting early in the second quarter, you had a pretty good idea of what they needed to sell. These stocks started collapsing as arbs pressed their shorts and longs stepped away. Who would buy before the index was finished selling?
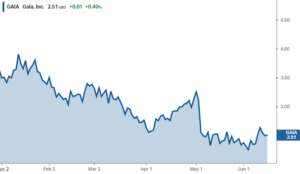
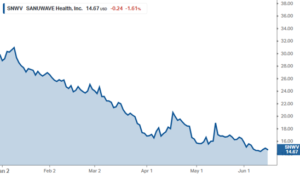
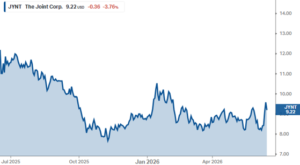
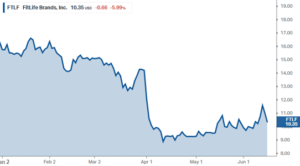
Look at some of the charts below; the damage is gruesome. We’re not saying that some of these businesses aren’t challenged, but they didn’t all get dramatically worse at some point in April. Index funds may have worked fine when the index owned a few percent of the company. Now the index fund is the largest shareholder and cannot enter or exit without wrecking the chart. It’s like the good old days of clean-up prints. Even worse, they tell you exactly how to make money off them.
The Russell can’t keep its winners
But while the Russell gets a lot of flak for pre-announcing what it will sell, it’s also incapable of holding onto its winners. In an index where over half of the companies lack profitability, structural compounders are rare. But when they do exist, Russell will be sure to give them the boot the moment their market cap reaches the $5 billion upper bound.
It is no surprise that the Russell 2000 has been a popular funding short for many funds.
This year, that might well be different.
Given the recent rally in small caps, some companies such as Bloom Energy (BE) have run up to an $80b market cap before the Russell had time to boot them from the index. In total, 43 Russell 2000 companies, or 16% of the index, will migrate upward. Many of those companies this year seem to be either complete stock promotions or otherwise cyclical companies at peak multiples.
We saw the same movie with Super Micro (SMCI). It graduated to the Russell 1000 near the highs, only to implode months later following the Hindenburg report and the auditor’s resignation. The Russell escaped the inevitable move down, and all relative performance investors lost out. This year feels similar, just at a much larger scale.

So how do we play this? Finding companies that are about to be included in the Russell 2000 can be a profitable trade, but this trade was many months ago, at the start of the year. All that’s left to do now is wait until 4 pm on Friday, when more than $200 billion in trades will need to be crossed. That usually leads to some last-minute fireworks, but that’s not what we’re here for.
We’re here to find the few live bodies in the aftermath. The few companies that aren’t on their way to bankruptcy. The select few that are worth owning. This is a small-cap game, so we will all have to do our own work, but if it’s got a strong balance sheet and it’s a business model that we are familiar with (SNWV, GAIA, JYNT, FTLF), we are definitely updating our models ahead of the cleanup print this Friday.

Russell 3000 Deletions and Additions.
R1 top ADV to buy
| Ticker | Company | Index | Newly Added (Y/N) | Shares to be traded | Shares as % of ADV | Market value (M) | Market cap (M) | Return (YTD) (%) | Return (since effective) (%) |
| SUNB | Sunbelt Rentals Holdings Inc | Russel 1000 | Y | 13,607,222 | 548% | 1,079.9 | 34,854 | – | 6% |
| ULS | UL Solutions Inc | Russel 1000 | Y | 2,937,451 | 422% | 284.4 | 18,354 | 16% | -6% |
| GFL | GFL Environmental Inc | Russel 1000 | Y | 9,745,604 | 417% | 346.1 | 12,454 | -20% | -3% |
| ASND | Ascendis Pharma A/S | Russel 1000 | Y | 2,565,630 | 375% | 539.9 | 14,435 | 9% | 11% |
| ALM | Almonty Industries Inc | Russel 1000 | Y | 11,198,892 | 242% | 182.7 | 5,192 | 108% | 12% |
| AU | Anglogold Ashanti Plc | Russel 1000 | N | 5,590,734 | 235% | 470.3 | 45,285 | 8% | 6% |
| AUGO | Aura Minerals Inc | Russel 1000 | Y | 2,125,187 | 222% | 128.4 | 5,217 | 26% | 3% |
| SPG | Simon Property Group Inc | Russel 1000 | N | 3,282,022 | 220% | 690.2 | 68,994 | 17% | 2% |
| CHYM | Chime Financial Inc | Russel 1000 | Y | 9,933,695 | 200% | 173.6 | 6,601 | -31% | -1% |
| JAN | Janus Living Inc | Russel 1000 | Y | 1,735,744 | 175% | 43.6 | 6,690 | – | 2% |
| SOLS | Solstice Advanced Materials In | Russel 1000 | N | 3,318,792 | 159% | 268.9 | 13,525 | 76% | 5% |
| JBS | JBS NV | Russel 1000 | Y | 12,222,797 | 147% | 149.6 | 12,920 | -10% | -1% |
| ROK | Rockwell Automation Inc | Russel 1000 | N | 1,141,447 | 145% | 509.9 | 52,786 | 23% | 6% |
| FIGR | Figure Technology Solutions In | Russel 1000 | N | 4,871,557 | 132% | 138.8 | 6,060 | -33% | -4% |
| GLXY | Galaxy Digital Inc | Russel 1000 | Y | 7,002,602 | 128% | 176.0 | 13,426 | 54% | 37% |
R1 top ADV to sell
| Ticker | Company | Index | Newly Added (Y/N) | Shares to be traded | Shares as % of ADV | Market value (M) | Market cap (M) | Return (YTD) (%) | Return (since effective) (%) |
| HWM | Howmet Aerospace Inc | Russel 1000 | N | 6,080,103 | 239% | 1,531.6 | 111,608 | 36% | 11% |
| ABBV | AbbVie Inc | Russel 1000 | N | 14,102,782 | 232% | 3,204.6 | 382,396 | -4% | -5% |
| HLT | Hilton Worldwide Holdings Inc | Russel 1000 | N | 3,570,778 | 209% | 1,225.1 | 80,334 | 23% | 3% |
| AMP | Ameriprise Financial Inc | Russel 1000 | N | 1,259,037 | 194% | 572.4 | 42,300 | -4% | 3% |
| VRTX | Vertex Pharmaceuticals Inc | Russel 1000 | N | 2,170,288 | 170% | 969.7 | 114,737 | 0% | 1% |
| LAMR | Lamar Advertising Co | Russel 1000 | N | 1,138,362 | 170% | 172.4 | 15,123 | 20% | -1% |
| CPAY | Corpay Inc | Russel 1000 | N | 895,846 | 162% | 311.3 | 22,634 | 15% | 0% |
| BNY | Bank of New York Mellon Corp/T | Russel 1000 | N | 5,518,632 | 154% | 785.8 | 99,010 | 25% | 1% |
| PWR | Quanta Services Inc | Russel 1000 | N | 1,602,743 | 129% | 1,114.1 | 106,487 | 68% | 2% |
| UHAL/B | U-Haul Holding Co | Russel 1000 | N | 545,693 | 128% | 28.1 | 10,923 | 18% | 7% |
| AON | Aon PLC | Russel 1000 | N | 1,727,658 | 115% | 567.6 | 67,977 | -9% | -3% |
| BR | Broadridge Financial Solutions | Russel 1000 | N | 1,764,883 | 112% | 267.1 | 15,834 | -38% | -9% |
| KNSL | Kinsale Capital Group Inc | Russel 1000 | N | 365,006 | 111% | 111.7 | 7,073 | -21% | 0% |
| EXEL | Exelixis Inc | Russel 1000 | N | 3,012,978 | 110% | 158.8 | 13,093 | 19% | -1% |
| DECK | Deckers Outdoor Corp | Russel 1000 | N | 2,334,282 | 109% | 252.4 | 15,274 | 6% | 2% |
R2 top ADV to buy
| Ticker | Company | Index | Newly Added (Y/N) | Shares to be traded | Shares as % of ADV | Market Value (M) | Market Cap (M) | Return (YTD) (%) | Return (since effective) (%) |
| CAMP | CAMP4 Therapeutics Corp | Russel 2000 | Y | 4,269,729 | 5559% | 17.5 | 216 | -32% | 1% |
| AVBC | Avidia Bancorp Inc | Russel 2000 | Y | 2,481,729 | 4962% | 47.7 | 394 | 17% | 2% |
| CHCI | Comstock Holding Cos Inc | Russel 2000 | Y | 486,729 | 3878% | 8.1 | 152 | 28% | -10% |
| CMTV | Community Bancorp/VT | Russel 2000 | Y | 690,045 | 3852% | 26.6 | 221 | 62% | 2% |
| ISBA | Isabella Bank Corp | Russel 2000 | Y | 939,977 | 3469% | 39.6 | 295 | -19% | -5% |
| NERV | Minerva Neurosciences Inc | Russel 2000 | Y | 4,600,429 | 3385% | 22.8 | 196 | 4% | -15% |
| FNRN | First Northern Community Banco | Russel 2000 | Y | 2,035,759 | 3245% | 35.1 | 298 | 43% | 5% |
| KORE | KORE Group Holdings Inc | Russel 2000 | Y | 781,924 | 3131% | 7.2 | 162 | 118% | 0% |
| METCB | Ramaco Resources Inc | Russel 2000 | Y | 950,139 | 3107% | 11.2 | 876 | -15% | -18% |
| CD | Chaince Digital Holdings Inc | Russel 2000 | N | 4,240,903 | 3053% | 22.6 | 383 | -3% | -10% |
| XFOR | X4 Pharmaceuticals Inc | Russel 2000 | Y | 10,951,966 | 2984% | 41.9 | 394 | 4% | 9% |
| ZSQR | Z Squared Inc | Russel 2000 | Y | 5,926,264 | 2679% | 60.0 | 821 | 12% | 58% |
| RDNW | RideNow Group Inc | Russel 2000 | Y | 2,127,654 | 2523% | 15.5 | 286 | 34% | 1% |
| BBUC | Brookfield Business Corp | Russel 2000 | N | 6,627,081 | 2470% | 218.0 | 6,836 | -7% | 1% |
| SGP | SpyGlass Pharma Inc | Russel 2000 | Y | 1,497,320 | 2463% | 28.1 | 616 | – | -2% |
R2 top ADV to sell
| Ticker | Company | Dropped from Index | Shares to be traded | Shares as % of ADV | Market value (M) | Market cap (M) | Return (YTD) (%) | Return (since effective) (%) |
| SBFG | SB Financial Group Inc | Russel 2000 | 705,515 | 6646% | 15.7 | 142 | 3% | 2% |
| RVSB | Riverview Bancorp Inc | Russel 2000 | 2,514,281 | 6102% | 14.2 | 117 | 16% | 2% |
| CSPI | CSP Inc | Russel 2000 | 848,377 | 5921% | 7.6 | 84 | -33% | -6% |
| SLSN | Solesence Inc | Russel 2000 | 2,292,906 | 5513% | 3.0 | 94 | -17% | 2% |
| FNWD | Finward Bancorp | Russel 2000 | 426,837 | 4603% | 13.9 | 145 | -4% | 4% |
| SFBC | Sound Financial Bancorp Inc | Russel 2000 | 266,332 | 4597% | 11.3 | 108 | -3% | -1% |
| BSET | Bassett Furniture Industries I | Russel 2000 | 1,013,647 | 4436% | 14.4 | 136 | -4% | 11% |
| AOUT | American Outdoor Brands Inc | Russel 2000 | 1,528,071 | 4354% | 15.0 | 126 | 29% | 2% |
| SIEB | Siebert Financial Corp | Russel 2000 | 1,755,268 | 4065% | 3.3 | 80 | -44% | 4% |
| EML | Eastern Co/The | Russel 2000 | 714,712 | 3976% | 15.4 | 137 | 16% | 5% |
| KG | Kestrel Group Ltd | Russel 2000 | 330,436 | 3897% | 3.9 | 88 | 10% | -6% |
| HFFG | HF Foods Group Inc | Russel 2000 | 4,994,041 | 3632% | 9.3 | 102 | -12% | 2% |
| RPT | Rithm Property Trust Inc | Russel 2000 | 873,327 | 3612% | 12.7 | 112 | -9% | -1% |
| LFT | Lument Finance Trust Inc | Russel 2000 | 5,675,494 | 3475% | 5.8 | 55 | -23% | 3% |
| VIRC | Virco Mfg. Corp | Russel 2000 | 1,407,377 | 3391% | 8.2 | 98 | -2% | 7% |
Gold, silver and all that glitters
As part of our mid-year thematic review, we want to revisit mineral drilling. Last week we covered Wound Care and introduced Trade Schools. This week, it is time to put the hard hats back on.
After a prolonged downcycle in the 2010s, life started to look better for gold bugs. Excessive Covid stimulus, inflation, and a growing list of geopolitical conflicts pushed investors back toward the yellow metal.
The war in Ukraine also reminded governments that keeping at least some reserves in gold instead of US dollars might not be the worst idea.
As you know, we have tried various ways to play the theme. Gold.com (GOLD) / formerly A-Mark Precious Metals failed to grow their earnings meaningfully as retail demand for gold languished, but their shares took off anyway when they changed their ticker to GOLD, which, to be fair, is a pretty cool ticker to have.
We also mentioned Sprott (SII) in our year-end review as a play on retail flows into gold ETFs.
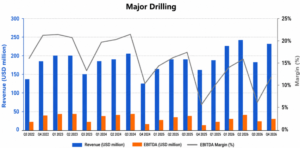
Today, though, is about Major Drilling (MDI CN), the only publicly traded, scaled hard rock mineral driller and one of our preferred ways to play the theme.
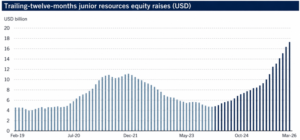
We wrote in March of last year about Trump’s desire to re-energize the US mining industry. We updated on this theme in December when we saw the first signs of senior miners raising capital to blow on their next exploration adventure.
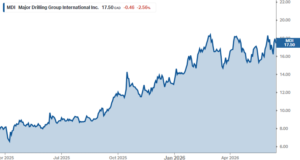
MDI reported earnings last week, and for the first time in what feels like three years, earnings weren’t terrible. FY2026 has been a disappointing year so far; despite the Explorin acquisition, MDI has been unable to grow its earnings.
Q4 might well have been the turning point. Growth was driven by the US and Canada, where revenue was up 67%. Encouragingly, pro-mining governments now run Peru and Chile, and Colombia might soon be headed in the same direction.
This is all about the miners’ ability to raise capital. If they can raise fresh dollars, there is no limit to what a Vancouver-based CEO with a hard hat is willing to pay for a drill rig, because a few promising drill results are often all that is needed to set up the next capital raise.
Importantly, global exploration budgets are still roughly 60% below the 2012 peak, before adjusting for inflation.
We have a long way to go.
While we expect revenue to grow rapidly from here, margins will likely continue to lag as the company ramps up hiring (job postings have gone vertical in recent months) and mobilizes for new projects. The real bottleneck is finding skilled labor willing to work in remote areas of the world and to operate a rig (maybe another UTI / LINC course incoming?).