Our thinking hasn’t changed since last week, but this week’s price action is worth revisiting. In summary, we’re bears. Now raging Kodiak Bears…
We were just starting out in this business when we realized that the wheels were coming off the tech bubble and spending on networking was about to fall off a cliff, to be replaced by cancelled orders. While we’re not big on analogs, we can’t help but note how similar these two chart look, 24 years removed. Top is CSCO, poster child for the ‘value’ way to play the internet bubble. Below is SMH, as semis are the ‘value’ way to play the AI bubble. They’re similar, yet ever so slightly different. Note the fade lower—no crash…
That said, having lived through two equity bubbles that peaked with extreme stupidity (2000 and 2021), we can’t help but wonder where are the excesses on the margin side??
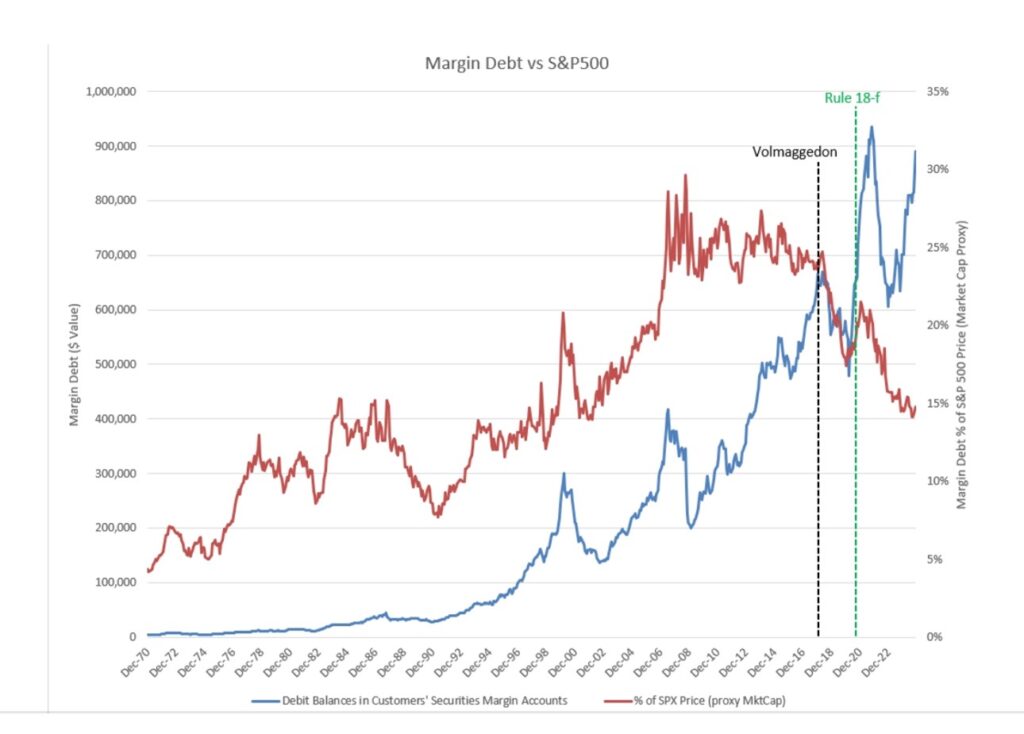
We’re shamelessly stealing this chart from Mike Green’s substack (you should subscribe), and it shows that while overall margin balances are back up near 2021 levels, as a percentage of market cap, they’ve continued to decline. With that in mind, where is the leverage??
I’ve been pondering this a lot. Mike makes the case that there’s as much as $1 trillion in additional leverage shoved into leveraged ETFs, and various structured products. While I’m sure the number is massive in these products, $1 trillion sounds too large, as it would effectively double the official margin balances. Then again, I know that retail loves to play with leverage and given how speculative the market feels, I know they’re active. But where??
What if they’re all hiding in the options market?? We have lots of data showing that all sorts of option volumes have exploded, particularly 0DTE. However, we cannot tell if these are retail punters, or institutional boys, or some combination. What if hundreds of billions of notional are not showing up in the margin data because everyone is now using options?? Options were highly sophisticated back in 2000 (we don’t even think our broker had them on the platform), now everyone can play with options. What if that’s the missing piece??
It’s scary to contemplate. If you’re using margin, the interest expense is a few basis points a week. It ticks along against your equity, but it’s managable—as long as share prices don’t drop. Options are different. That Theta burns, and fast—especially if you’re playing with the sort of OTM paper that retail punters love.
Remember, the first rule of Ponzi Schemes is that they’re either inflating or deflating. They’re never at equilibrium, and they’re highly unstable. An equity bubble built on 3-month OTM call options, is far less stable than one built on 150% LTV margin debt. As Theta ticks along, dealers sell down their hedges, and the rest is simply gravity…(though we’re open to other explanations for where the margin debt went)
In any case, we’re increasingly convinced that the top is now in for US equity markets. The only question is; if we grind lower like in 2022, or we get real fireworks on the way down. We’ve tightened up our stops on our shorts, and going to let it ride…
With that in mind, it’s worth mentioning what we’re buying… After stopping out on a lot of our China exposure in Q4, we’re back at it. We think that China is actually doing fiscal now. They’re going to increase deficits. Monetary policy is stimulative, but fiscal is the real bazooka. Remember, Xi is telling his boys “I don’t wanna do too much and create a bubble, but it’s been 3 months and nothing is happening, so do some more.” We tend to think that economics works with unpredictable lags. Eventually, it will turn out that Xi did too much. We’re long and the charts look like a soft pullback into the David Tepper breakout range. Meanwhile, Western sentiment on China is as bearish as we can remember, but Trump has kept his mouth shut. Is a ‘deal’ brewing??
If China does reboot, then US equity markets are, technically speaking, absolutely fuct…
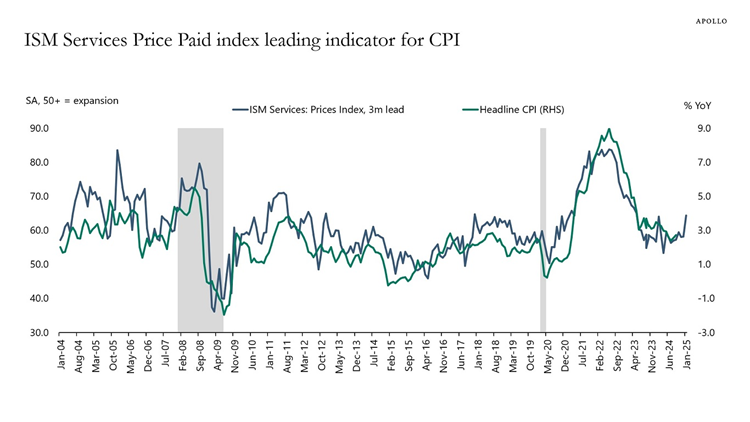
Just look at how stubborn inflation has been despite the world being in an industrial recession. ISM prices paid just up-ticked, and oil was $70 during December. Now it’s roughly 10% higher. For that matter, notice how oil woke up over the past few days. Maybe inventory numbers actually matter, as timespreads go vertical…
Did we tell you we’re bearish??? This is how we really feel…
We’re going to use TLT, as everyone seems to cue off this retail product. We’re open to the idea that as the market melts, TLT may bounce a bit. It really is oversold. But this is the chart to watch. If TLT takes out the lows from October 2023, watch out!! We’re of the view that bonds are leading equities here, so bonds are the only thing that matter—at least until we get Q4 earnings.
We’ve had conversations with many friends in the past week. There are two camps of thought out there.
-Stop being bearish and dramatic, just buy the stuff going up…
-We agree with you. It feels extremely late-cycle here. But, as long as the music is playing, you’ve got to get up and dance. We’ve tightened our stops and if it starts to roll, we’re gonna hit the bids faster than Diddy at a Boy Scout Jamboree (sorry)
We think that if charts break, then the real selling starts. If we’re right about the options hiding the true margin length, once the selling starts, it won’t stop. Anyway, this is our view. We hate going short. We’re still really damn long, but layered a lot of puts and shorts on top of it to take our net down. Let’s see how it plays…

Where Did the Margin Go??
A low frequency but juicy strategy where the edge is government incompetence.
Let’s dig in…
Our thinking hasn’t changed since last week, but this week’s price action is worth revisiting. In summary, we’re bears. Now raging Kodiak Bears…
We were just starting out in this business when we realized that the wheels were coming off the tech bubble and spending on networking was about to fall off a cliff, to be replaced by cancelled orders. While we’re not big on analogs, we can’t help but note how similar these two chart look, 24 years removed. Top is CSCO, poster child for the ‘value’ way to play the internet bubble. Below is SMH, as semis are the ‘value’ way to play the AI bubble. They’re similar, yet ever so slightly different. Note the fade lower—no crash…
That said, having lived through two equity bubbles that peaked with extreme stupidity (2000 and 2021), we can’t help but wonder where are the excesses on the margin side??
We’re shamelessly stealing this chart from Mike Green’s substack (you should subscribe), and it shows that while overall margin balances are back up near 2021 levels, as a percentage of market cap, they’ve continued to decline. With that in mind, where is the leverage??
I’ve been pondering this a lot. Mike makes the case that there’s as much as $1 trillion in additional leverage shoved into leveraged ETFs, and various structured products. While I’m sure the number is massive in these products, $1 trillion sounds too large, as it would effectively double the official margin balances. Then again, I know that retail loves to play with leverage and given how speculative the market feels, I know they’re active. But where??
What if they’re all hiding in the options market?? We have lots of data showing that all sorts of option volumes have exploded, particularly 0DTE. However, we cannot tell if these are retail punters, or institutional boys, or some combination. What if hundreds of billions of notional are not showing up in the margin data because everyone is now using options?? Options were highly sophisticated back in 2000 (we don’t even think our broker had them on the platform), now everyone can play with options. What if that’s the missing piece??
It’s scary to contemplate. If you’re using margin, the interest expense is a few basis points a week. It ticks along against your equity, but it’s managable—as long as share prices don’t drop. Options are different. That Theta burns, and fast—especially if you’re playing with the sort of OTM paper that retail punters love.
Remember, the first rule of Ponzi Schemes is that they’re either inflating or deflating. They’re never at equilibrium, and they’re highly unstable. An equity bubble built on 3-month OTM call options, is far less stable than one built on 150% LTV margin debt. As Theta ticks along, dealers sell down their hedges, and the rest is simply gravity…(though we’re open to other explanations for where the margin debt went)
In any case, we’re increasingly convinced that the top is now in for US equity markets. The only question is; if we grind lower like in 2022, or we get real fireworks on the way down. We’ve tightened up our stops on our shorts, and going to let it ride…
With that in mind, it’s worth mentioning what we’re buying… After stopping out on a lot of our China exposure in Q4, we’re back at it. We think that China is actually doing fiscal now. They’re going to increase deficits. Monetary policy is stimulative, but fiscal is the real bazooka. Remember, Xi is telling his boys “I don’t wanna do too much and create a bubble, but it’s been 3 months and nothing is happening, so do some more.” We tend to think that economics works with unpredictable lags. Eventually, it will turn out that Xi did too much. We’re long and the charts look like a soft pullback into the David Tepper breakout range. Meanwhile, Western sentiment on China is as bearish as we can remember, but Trump has kept his mouth shut. Is a ‘deal’ brewing??
If China does reboot, then US equity markets are, technically speaking, absolutely fuct…
Just look at how stubborn inflation has been despite the world being in an industrial recession. ISM prices paid just up-ticked, and oil was $70 during December. Now it’s roughly 10% higher. For that matter, notice how oil woke up over the past few days. Maybe inventory numbers actually matter, as timespreads go vertical…
Did we tell you we’re bearish??? This is how we really feel…
We’re going to use TLT, as everyone seems to cue off this retail product. We’re open to the idea that as the market melts, TLT may bounce a bit. It really is oversold. But this is the chart to watch. If TLT takes out the lows from October 2023, watch out!! We’re of the view that bonds are leading equities here, so bonds are the only thing that matter—at least until we get Q4 earnings.
We’ve had conversations with many friends in the past week. There are two camps of thought out there.
-Stop being bearish and dramatic, just buy the stuff going up…
-We agree with you. It feels extremely late-cycle here. But, as long as the music is playing, you’ve got to get up and dance. We’ve tightened our stops and if it starts to roll, we’re gonna hit the bids faster than Diddy at a Boy Scout Jamboree (sorry)
We think that if charts break, then the real selling starts. If we’re right about the options hiding the true margin length, once the selling starts, it won’t stop. Anyway, this is our view. We hate going short. We’re still really damn long, but layered a lot of puts and shorts on top of it to take our net down. Let’s see how it plays…
Start your 28-day free trial
Kuppy’s Event Driven Monitor (“KEDM”) is not a financial or investment advisor and the information contained in this publication is not intended to constitute legal, accounting, or text advice or individually-tailored investment advice and is not designed to meet your personal financial situation. The investments discussed in this publication may not be suitable for you. You are required to conduct your own due diligence, analyses, draw your own conclusions, and make your own investment decisions. Any areas concerning legal, accounting, or tax advice or individually-tailored investment advice should be referred to your lawyers, accountants, tax advisors, investment advisers, or other professionals registered or otherwise authorized to provide such advice. KEDM makes no recommendations whatsoever regarding buying, selling, or holding a specified security, a class of securities, or the securities of a class of issuers, and all commentary is for educational purposes only. The investment examples noted are intended to provide and example of the events and data KEDM flags each week and is not representative of typical returns generated by each event or any future returns.